CIB Mango Tree
A Civic Tech DC Project
Username
Unique Post Number
Timestamp
Post Content
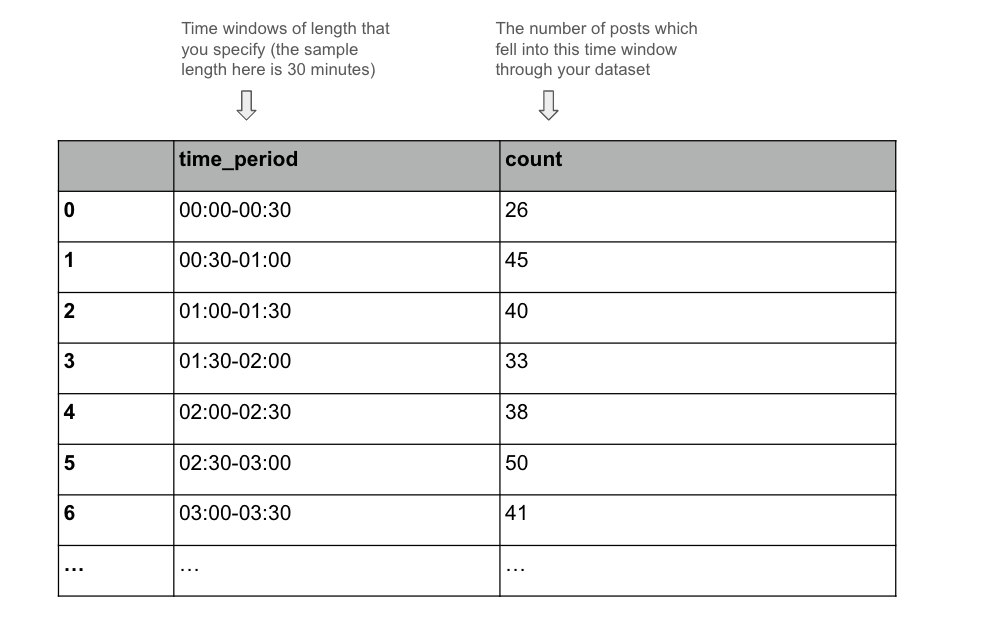
- Set Time Window Length: Start by specifying the desired length of your time windows for the 24-hour period (recommended: 30 minutes).
- Tally Posts: The test will count the posts made in each time window across your dataset. For example: with a 30-minute window, it will count posts from 12:00 AM to 12:30 AM, 12:30 AM to 1:00 AM, and so on.
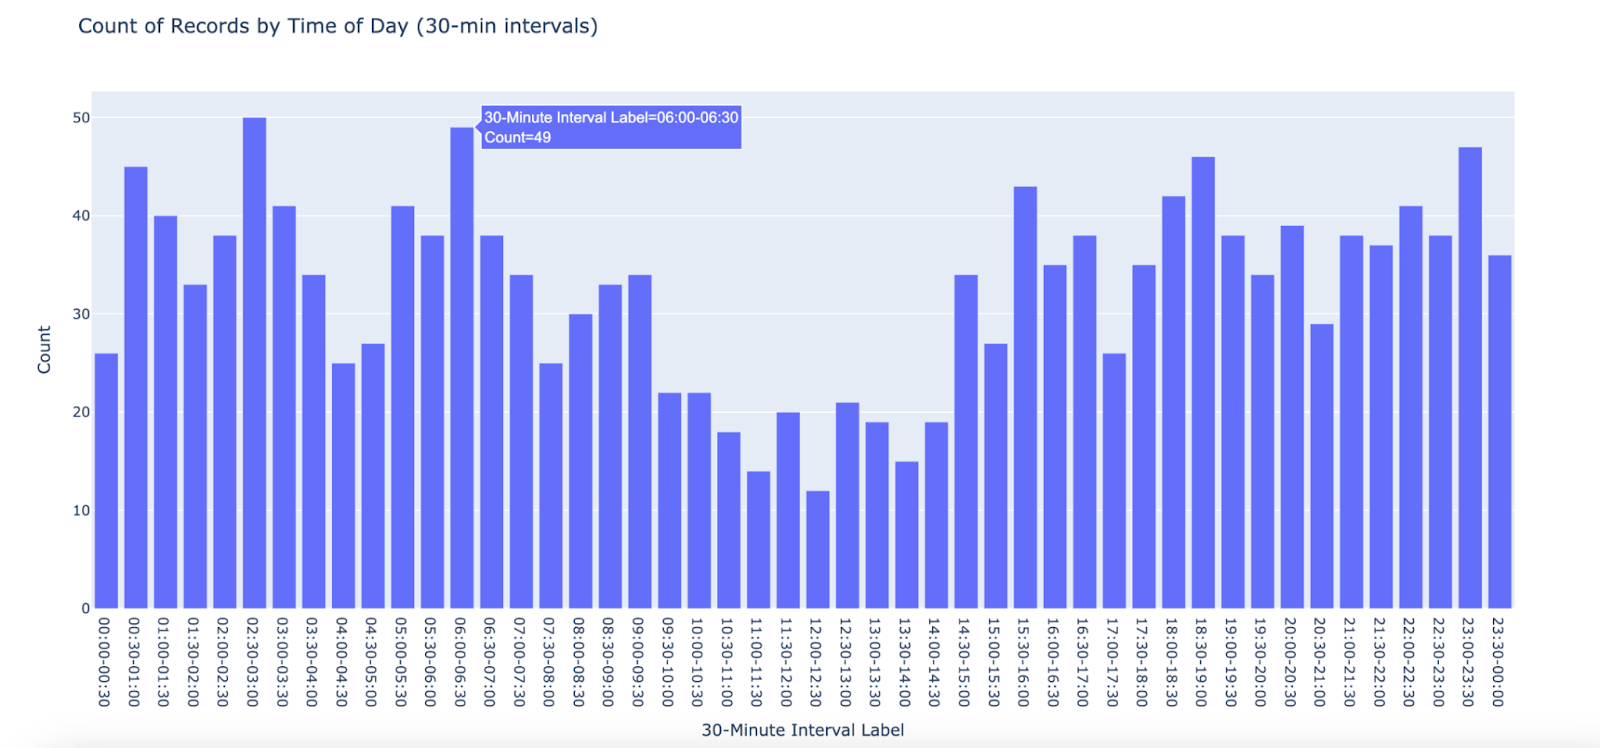
- Graph Results: Finally, the test will display these frequencies in a csv file and bar chart, with each bar representing a specific time window across the 24-hour period.
Output Format Option 1: .csv File
- The test will produce a .csv file that provides the numerical tallies of posts for each given time window in the 24-hour period.
Output Format Option 2: Offline Dashboard
- The test will also produce a link to a dashboard that can run offline in your browser (this dashboard does not require an internet connection). The dashboard will render the 24-hour graph of post frequency.